VALUE ANALYSIS / VALUE MANAGEMENT
Always one step ahead of the competition with value management
In the global environment, this method is indispensable for product development when it comes to competitiveness.
Value management describes a simple and efficient approach and ideally allows to increase the value of the product while reducing costs. The value analysis also includes an initial functional analysis, a cost analysis and a detailed analysis. However, this is always followed by a workshop to develop ideas in a cross-functional team. The tool for the value management process:
Workshops
– whether global or local –
definitely more digital
With the id-x | valueTracker, participants connect to the product or project via a QR code when entering the workshop room. A registration is not necessary. This reduces the inhibition threshold before new systems or apps and employees can get started immediately.
The id-x | valueTracker allows you to capture the generated ideas digitally – easily with the mobile devices of your employees. The collected ideas are displayed on the dashboard in real time and can be processed and categorized immediately. This is how you promote the digital transformation in your company with the id-x | valueTracker.
From the input of an idea to the implementation.
Whether in a global or local environment.
Whether as a workshop on site or completely digital, simultaneously from different locations.
The id-x | valueTracker adapts to your requirements.
The continuous improvement process will not only be successfully practiced in the company with this workflow but also leads to enormous cost savings, which can be communicated transparently and clearly. Cost savings without loss of quality or functionality – this is what your customers demand.
The id-x | valueTracker supports you in achieving this goal.
We will be pleased to help you and explain your opportunities.
WORKFLOWS with the ID-X | ValueTracker

Create any number of projects in the system and share them with other users

Employees capture ideas digitally right away with their own mobile devices

Workshop participants can immediately connect to the project via a QR code and start brainstorming ideas

The collected ideas are displayed in real time on the dashboard and can be analyzed immediately

Ideas can be evaluated in the system, prioritized and tracked until they are implemented

All ideas and solutions for any projects can be easily found and accessed from anywhere
Your advantages at a glance
Breaking boundaries
Supports global and digital collaboration
Standardization of terminologies and processes
Multilingual interface and data entry
Effective project management
Support and structuring of projects and workshops through all steps of the process
Support in meeting project goals
Achieving goals with workflows
Track and process ideas or defects until the solution is implemented
Freely define process steps and development phases
Automatic email notifications
Quick comparison
Easy and fast comparison of information from all levels
Simply select data you want to compare and press the „Compare“ button
Ad-hoc reports at any time
Reports & analyses at the push of a button from the system
Excel tables or native PowerPoints in attractive layouts
Multiple PPT layouts can be defined individually by the user
Easy data entry
Intuitive capture of information with own mobile devices
Easy connection with workshop or product with QR code
Search & find
Easy searching and finding of information, as full text or with advanced filter functions.
You can search for field names and contents at the same time – as conveniently as you are used to from common search engines
Calculate costs globally
Extensive calculation function with a wide range of calculation options
Integrated currency converter with automatic update
Specific access authorizations
Comfortable and extensive administration of users and user groups with extended access rights
Flexibility through cross-linking
Highly flexible cross-linking of information possible
Simple cross-linking of any kind of information - also to other departments or products
Build knowledge base
All projects, ideas and solutions in one database
Creation of a knowledge database - making proprietary knowledge available
SpecificIndividual look
Custom pages for theme-based structuring of the database
Branding through customization of logos and primary colors
WE SUPPORT YOU WITH OUR EXPERIENCE
For a certain time, Excel lists and presentations work well. Even when data is collected, paper and pencil always work. But as soon as people start searching for information or ideas, things start to get a bit complicated. At best, all files are stored in a structured and secure way on the company’s own servers. But without knowing where the data has been stored, finding information is often very time-consuming and practically impossible for colleagues. This is where a database makes sense and also simplifies data entry and analysis. But the step from Excel and paper to a database does not only bring opportunities but also risks. It all depends on the appropriate structuring of your data and processes. For this it is necessary to apply a combination of business knowledge and database knowledge. The system must be tailored to your business to increase effectiveness and provide a short term ROI. We want to share our many years of experience in this area with you and help you to successfully manage the digital transformation.
Value
Management
Product-
Benchmarking
Technology
Scoutimg
Highlights
Perceived
Quality
User
Experience
Customer
Feedback
GENERATE KNOWLEDGE FROM DATA
Data on measurements, ratings or photos of products are available on the market for every company. Every company can acquire the same data and use it for itself.
But data alone does not deliver added value. Valuable knowledge is only created by enriching the data with the know-how and experience of the company’s own employees. In addition, internal knowledge is often not or only insufficiently made available to other employees. Valuable knowledge is thus lost or simply inaccessible.
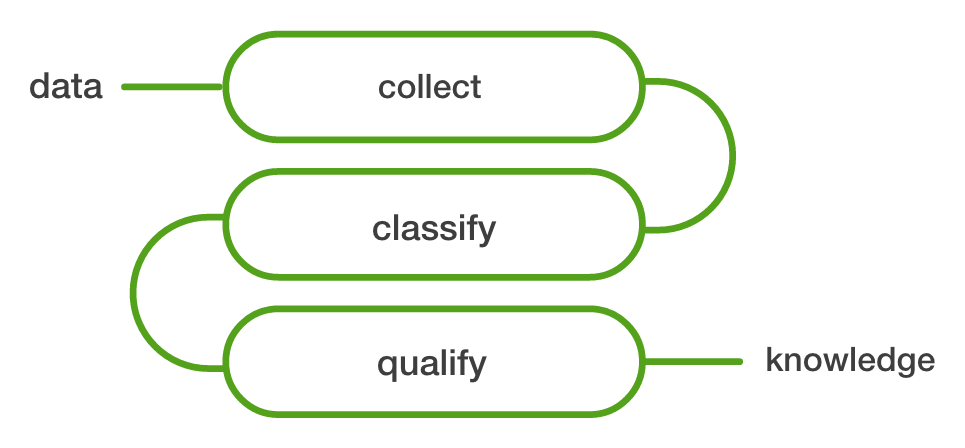
Modern companies are making it their goal to drive forward the digitization of processes and workflows. In doing so, procured data is enriched with proprietary knowledge and solutions are made available centrally and to all relevant departments.
The innovative and highly networkable id-x|platform helps you to realize these goals. Through interfaces, comfortable features and automatisms, simple data becomes valuable knowledge, which you can make available individually in the whole company.
SUPPORT CORPORATE GOALS
WITH THE
CONTINUOUS IMPROVEMENT
Plan, Do, Check, Act, the PDCA circle for continuous improvement with the id-x|platform:
PLAN / create, plan and manage projects
DO / collect information, ideas, improvement potentials with mobile devices of the employees
CHECK / check and enrich information with in-house know-how
ACT / Build a knowledge database and share knowledge within the company


DIGITAL TRANSFORMATION
For the digitization of processes it is not enough to just store information digitally on servers. Digitization with the id-x|platform has the goal of
- the easy searching and finding of information
- the continuous availability of knowledge and solutions throughout the company
- the possibility of global collaboration and the standardization of terminologies and processes
In addition, information, whether external or internal, can be enriched with the company’s own know-how, evaluated, classified and processed into solutions.
COST SAVINGS
A major cost factor in companies today, despite advancing digitization, is the administrative effort involved in data management. Collecting, preparing and sharing data takes a lot of time. With the helpful features of the id-x|platform this effort is reduced enormously to use resources more efficiently. Make your success measurable for a tangible ROI.


PRODUCT OPTIMIZATION
Due to the pressure of competition, companies are continuously challenged to make their products better and better and their processes more and more efficient and to use the advantages of digitalization.
Digitization helps to make knowledge transparent within the company. Solutions for improving products do not have to be developed several times, but are available to the development departments. New ideas and innovations are promoted and can be processed until they are implemented.
iTEMs – A MESH OF DATA OBJECTS
For high flexibility and various application
The ValueTracker is based on a structure of networked data objects (iTEMs) which, thanks to their flexibility and simplicity, can be used to map many use cases from product development. The iTEMS can be used to define any number of data objects of any size. This means that your use case can be mapped very precisely. In addition, users can create iTEMs themselves or modify existing ones.
iTEMs can be connected with each other as desired in order to map real use cases. For example, products can be linked to ideas and additionally to technologies, which in turn are linked to technology clusters or to assemblies / components.
iTEMs and clusters are the essential component of the ValueTracker. They make the ValueTracker the tool that integrates seamlessly into your development processes and immediately generates added value.
work the way you are used to,
BUT JUST A LITTLE better
Examples of id-x | platform features
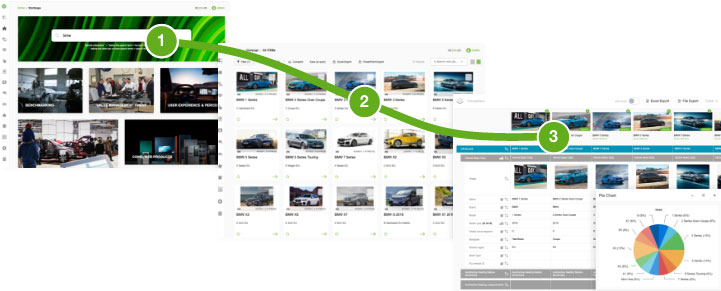
Quick comparison with only a few clicks
1. enter search term, 2. and compare found results 3. with a click.
Compare your data easily, no matter in which area of the database you are. You will be amazed how fast the ID-X platform compares your data.
Convenient analysis of your data
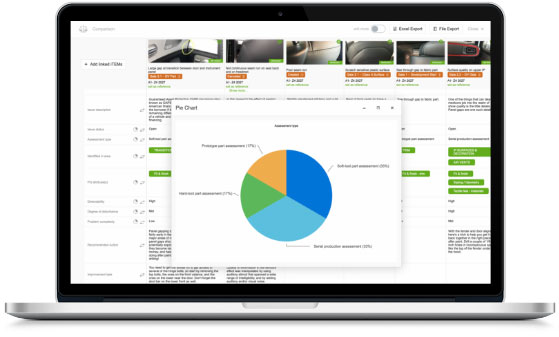
Compare any kind and any number of data with each other. In edit mode you can change data in the overview. In each comparison you can export your data as an Excel file and export files and images directly.
With the CSS Chart function, entire measurement series can be flexibly displayed and analyzed as a diagram.
All numerical values or selection lists can be displayed as pie charts, bar charts, line charts, radar charts or area charts.
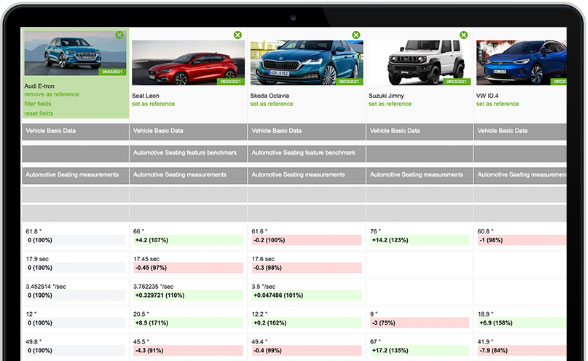
Performance comparison
Individual iTems (vehicle, project, idea, etc.) can be set as a reference and compared with others in the tabular overview. Deviations from the reference value are displayed graphically in an easy-to-understand manner. Various options can be used to define rules for when a value is displayed in green or red.
Design the user interface
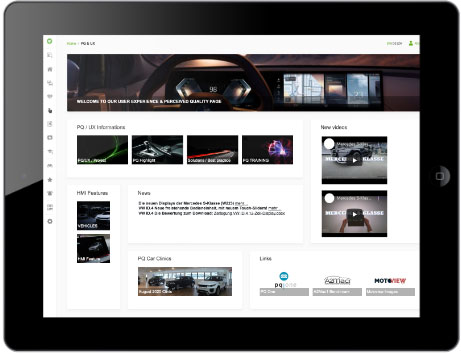
Id-x start pages allow you to structure your data individually tailored to your organization. Define the external appearance yourself and represent your department, for example.
Start pages can be defined individually for different product areas or user groups. Thus, everyone has the access to data that is permitted and desired.
Layout and content can be adjusted by authorized users at any time.
Determine what can be seen on your page, iTem lists, news, favorites, FAQs, movies, URLs, etc.
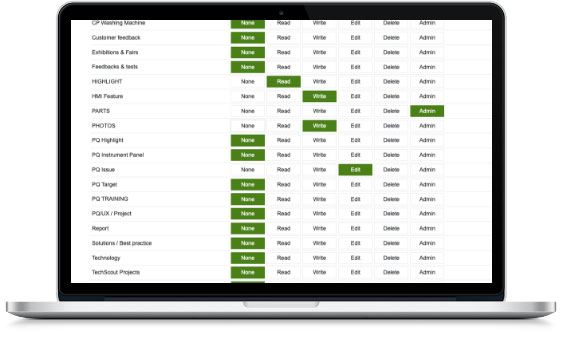
Control the access to your data
Create as many users as necessary and assign them a user group. Through this you can define exactly which products, projects, technologies, components or ideas are available.
Thus you have full control over your data and can determine exactly who should have no, read, write, edit, delete and administrator rights.
Create and customize reports
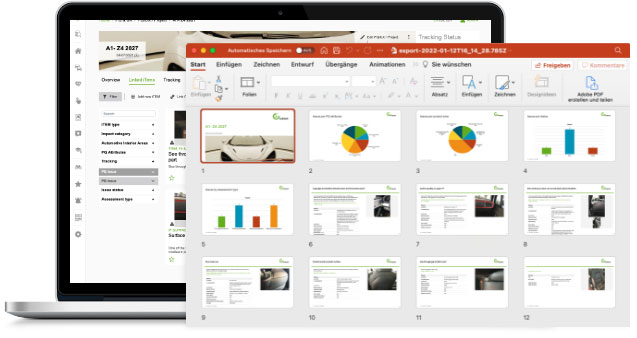
With the id-x PowerPoint Template Engine you can create several templates with different layouts yourself.
The native output format allows you to customize data and charts after exporting them to MS PowerPoint.
Do you want a simple tabular output of the data or a comprehensive report including charts and comparisons? With id-x|platform both is possible.
Further features of the id-x | platform
SINGLE SIGN ON
Secure Single Sign On (SSO) for easy and secure employee access
SELF-ADMIN
With the powerful administration you can customize and extend your database yourself
LICENSING
Simple licensing through an annual license fee
No limitation on the number of users or data
CLOUD / ON PREMISE
On premise, i.e. installed on your own servers or in the Calidat Cloud
MULTILINGUAL
Multi-language data and user interface
ACCESS PERMISSION
Extensive and comfortable user and user group management
Assignment of rights up to iTem level
The tool that creates knowledge

TYPICAL USE CASES AND VALUE ADD PROCESSES
WORKSHOPS
Value Management
Innovation Management
Design to Value
Idea Management
User Experience
RESEARCH
Technology Scouting
Exhibition Highlights
Start-Up Scouting
Consumer Feedback
BENCHMARKING
UX product clinics
Perceived Quality
Cost Analysis
Disassembly & BOM
CAPTURE AND REPORT

Capture highlights at any time, share immediately with your colleagues
How often have you had to collect a bunch of information on a specific topic to then share with your colleagues or present to your management? Collect information at the trade fair, in the car dealership or on the road with mobile devices, briefly compile the most important information and generate a finished PowerPoint presentation at the touch of a button, which also has the company’s own layout and can be changed as desired after export. A simple application of the ValueTracker.
TRACK ISSUES –
FIND SOLUTIONS
The tool to find solutions and solve problems
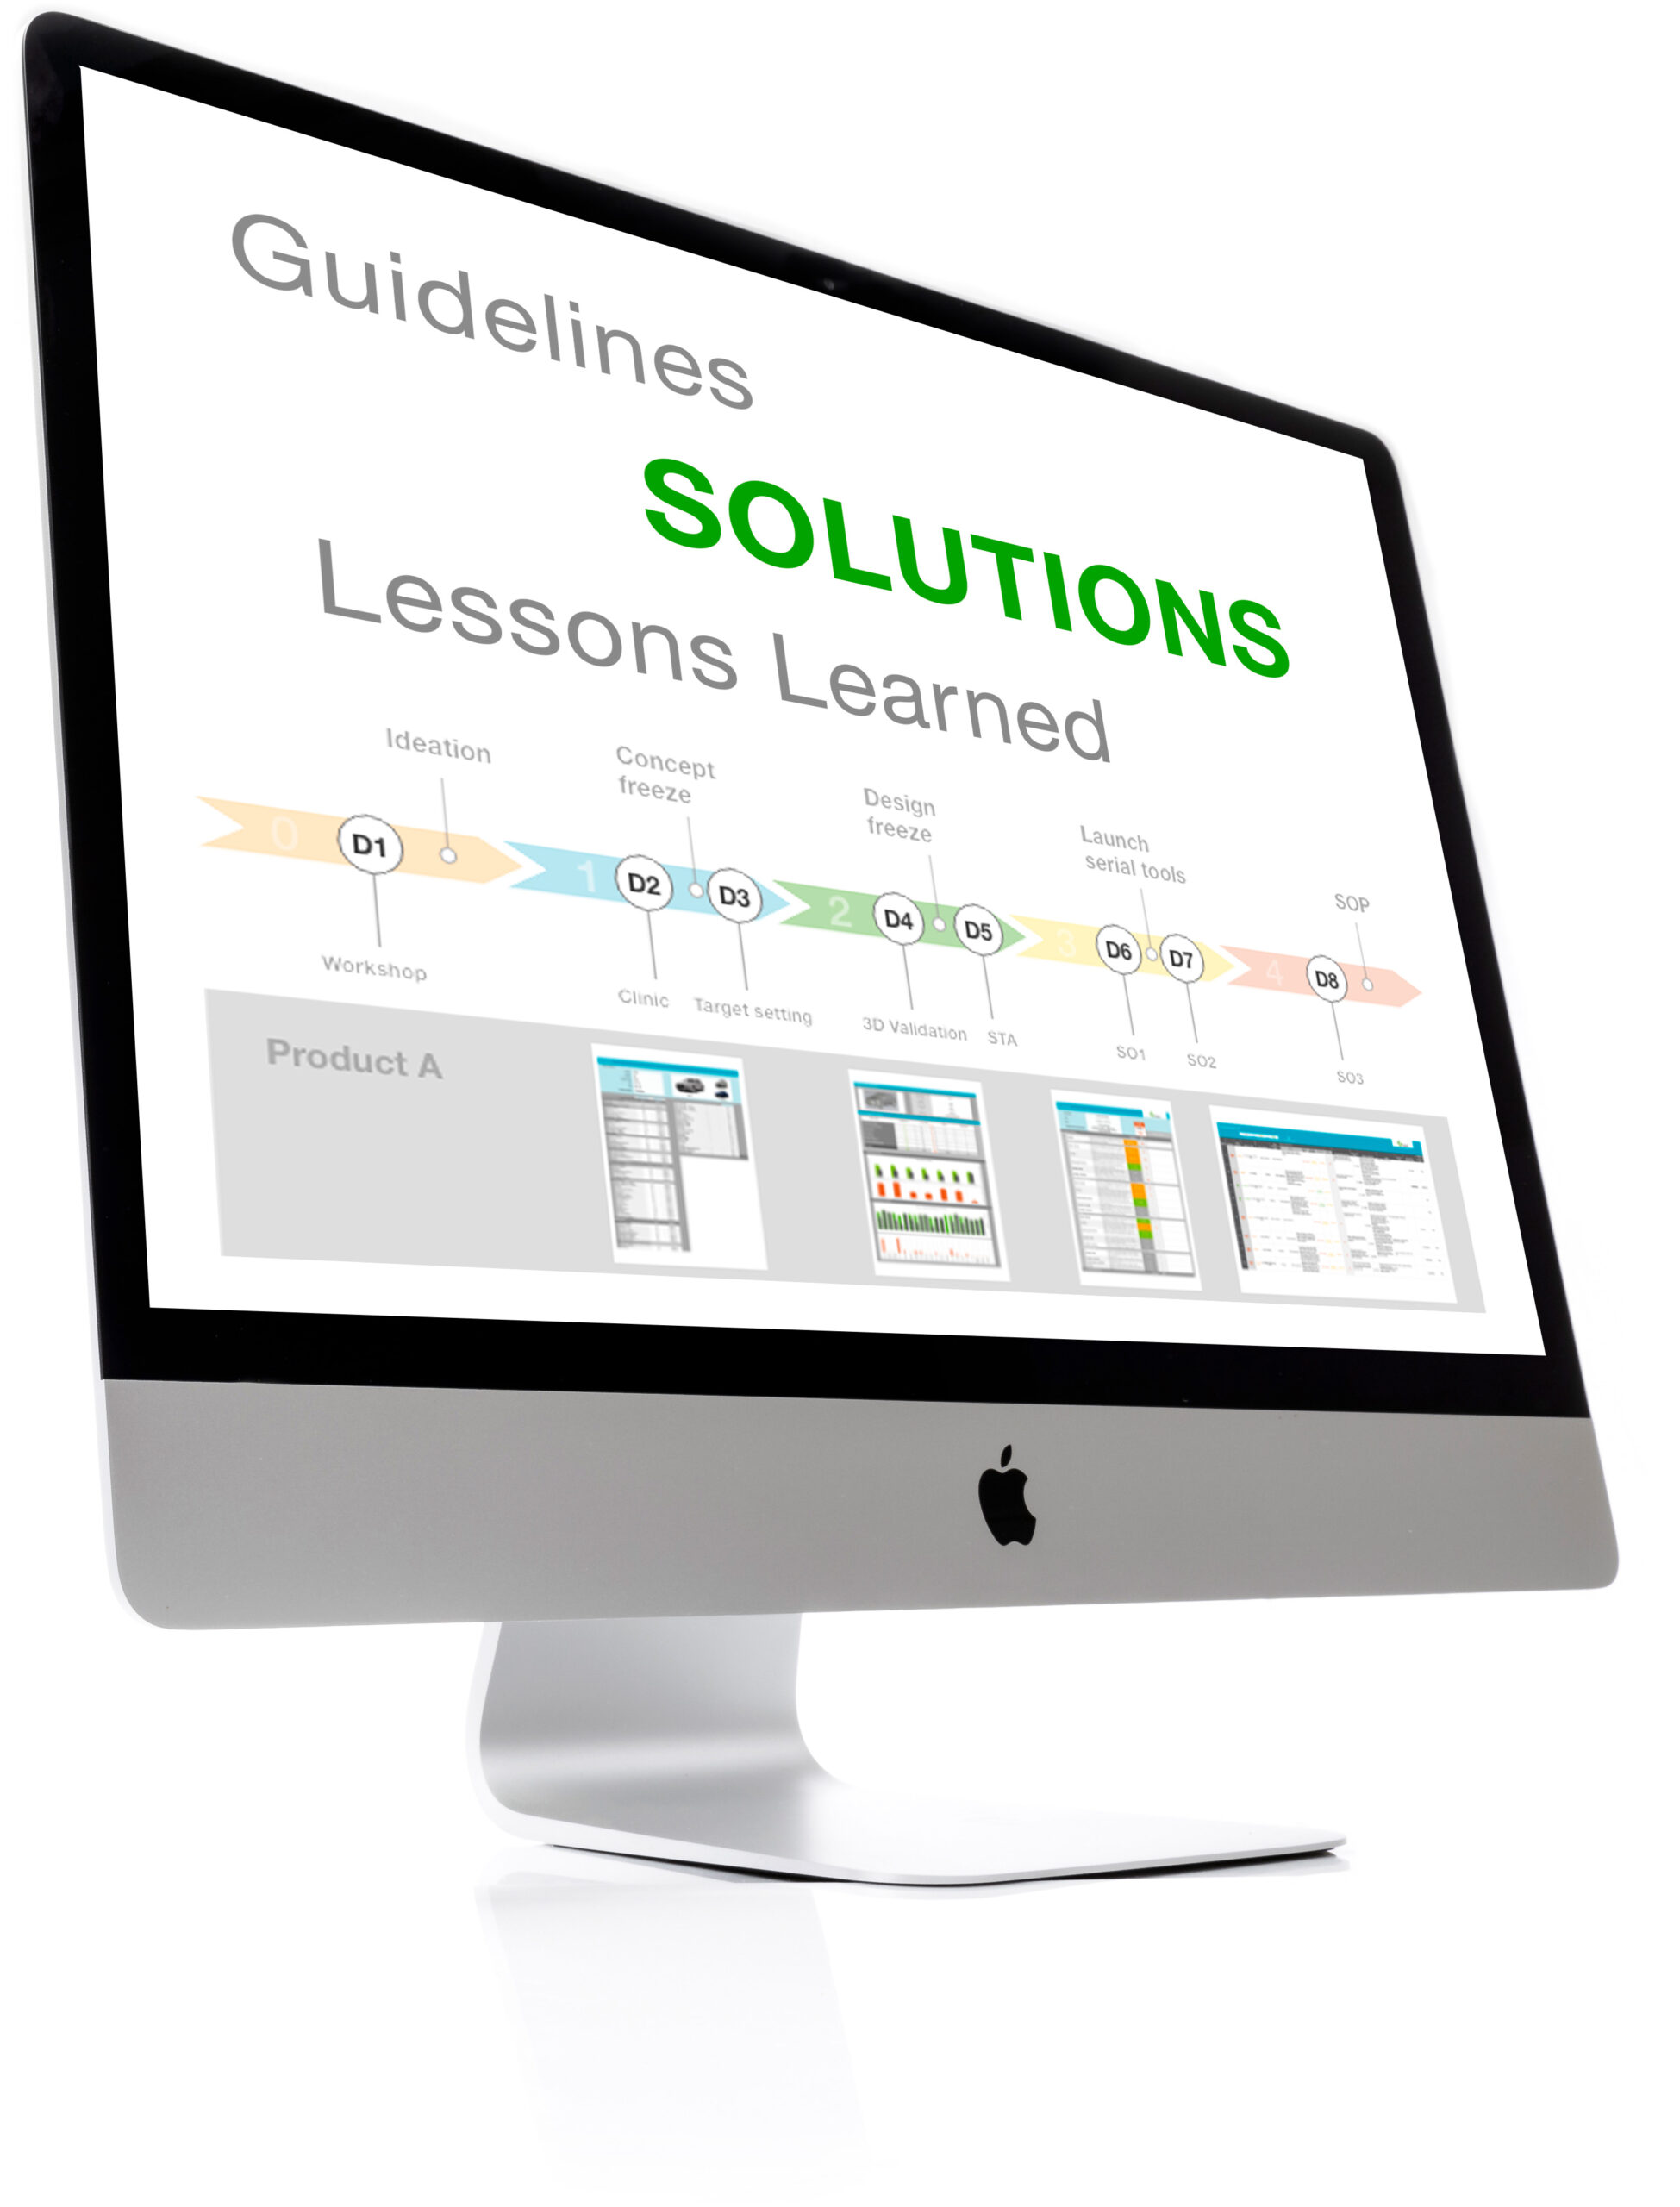
Instead of focusing on the problems, companies today concentrate on the solutions. Issues lists or LOPs (list of open points) help in project management to keep product development organised and structured and to always keep an eye on the problems. The goal is to find solutions to the problems in order to be able to check off the point. These solutions are often not documented or described. So other project groups have to look for the same solutions. The philosophy of guidelines, lessons learned or best practice are well known, but have never been so easy to implement as with the ValueTracker.
Carry out product audits with mobile devices, intelligently and automatically categorise the recorded data, simultaneously search for solutions, always keep an eye on the project status and distribute, receive and process tasks and map entire workflows. Do you have any questions? Get in touch with us.
FEATURES OF THE VALUETRACKER
Data entry
- User is additionally supported by Ai during data entry
- Input via mobile device (native app / QR-code) directly in the portal
- Input widgets (integration into existing software solutions)
- Excel import & Direct interface (API)
Classification
- Classification with the help of clusters
- Automatic suggestion or assignment of clusters (AI)
- Automatic enrichment with further data such as location (GPS), source, last entered data/cluster
Tracking
- Available tracking process for monitoring project phases
- Tasks can be assigned to users for the individual phases, which are monitored and tracked by the system
- Users have a corresponding portal page in which they can call up and process all their open tasks
Workflow
- Creating and forwarding tasks or information
- Automatic forwarding of tasks for review and completion
- Automated process of qualifying data, thus high data quality
Search & find
- Full text search or advanced cluster search
- Compilations, analyses or queries can be saved and shared with others and receive recognition
- Analyses can also be extended by others<
Output
- Clear and user-friendly portal
- Excel export
- PowerPoint export (in customer layout)
- PowerPoint reports with customised content (e.g. with individual charts and overviews)


DIGITAL WORKSHOPS
Efficiency through digitisation of workshops
The objective of a VA/VE workshop can be to reduce the costs of a product, to improve the quality or the scope of functions. For this purpose, entire products or only components are usually disassembled down to their individual parts and analysed by different experts. Each participant sketches ideas for this, which are collected afterwards and evaluated by the team. Without the help of digital solutions, an enormous amount of time is needed to process the information.

Take a picture and sketch
your notes on it
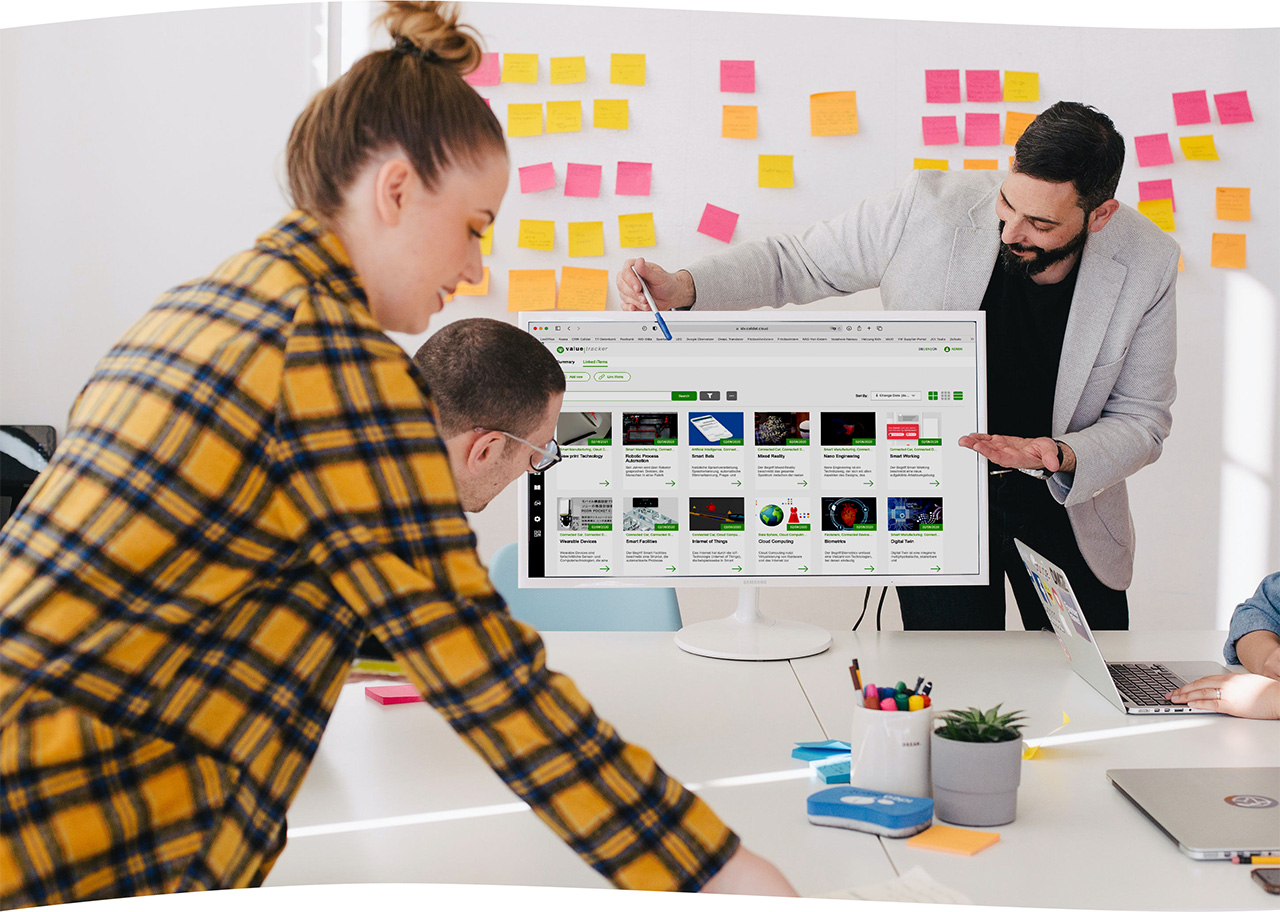
Collected ideas always in view and in real time

Get linked with product
With ValueTracker, participants connect to the product via a QR code when they enter the workshop room. Once connected, they can take photos of the individual parts on which they sketch their ideas and enrich them with information. The collected ideas can be analysed and evaluated by the team immediately after the idea collection without any additional effort. Ideas with potential can be monitored and tracked in ValueTracker until they are implemented. Digital from the start.
GET FEEDBACK,
IMPROVE YOUR PRODUCT
User-centred development – with user feedback
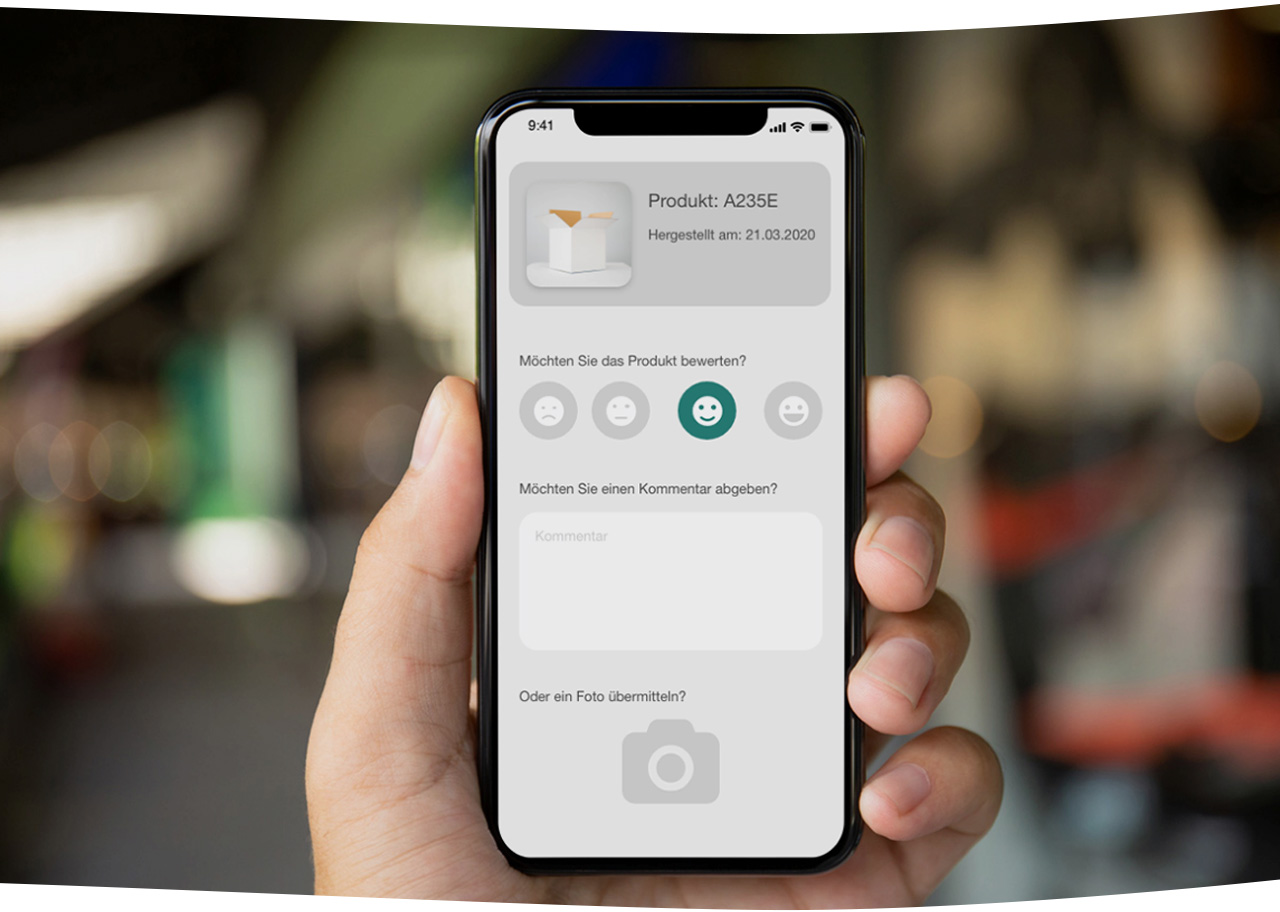
It often makes sense to ask colleagues or smaller focus groups about a topic in order not to develop without the user in mind. In the field of user experience and perceived quality, this method is regularly used to steer the project in the right direction.
With ValueTracker, focus groups can connect to the product questionnaire on site via QR code or they are invited to an online survey via a link. Here, the questionnaires can be created individually and always anew. However, the data remains bundled in one place and can be accessed, analysed and compared with other feedback at any time.


-
THE TOOLSET FOR YOUR PRODUCT
OPTIMIZATION PROCESSESGlobal competition makes continuous product optimization one of the biggest challenges for companies. Information on competitors is collected, ideas for optimization are developed and implementation of measures are tracked. The id-x|platform helps you to implement and digitalize these processes effectively and successfully.
